K8s events monitoring
For events monitoring you can use this ready-to-go elastic + kibana + k8s-event-exporter stack from: k8s-events-reporting
The premise
As part of an internal project at Dell, I needed to measure the time between the different PVC and PV states (Pending, Bound, Mounted, etc.) through their lifecycles.
The idea is to measure the performance of our different drivers (csi-powermax , csi-isilon , csi-vxflexos , csi-powerstore ) in various scenarios.
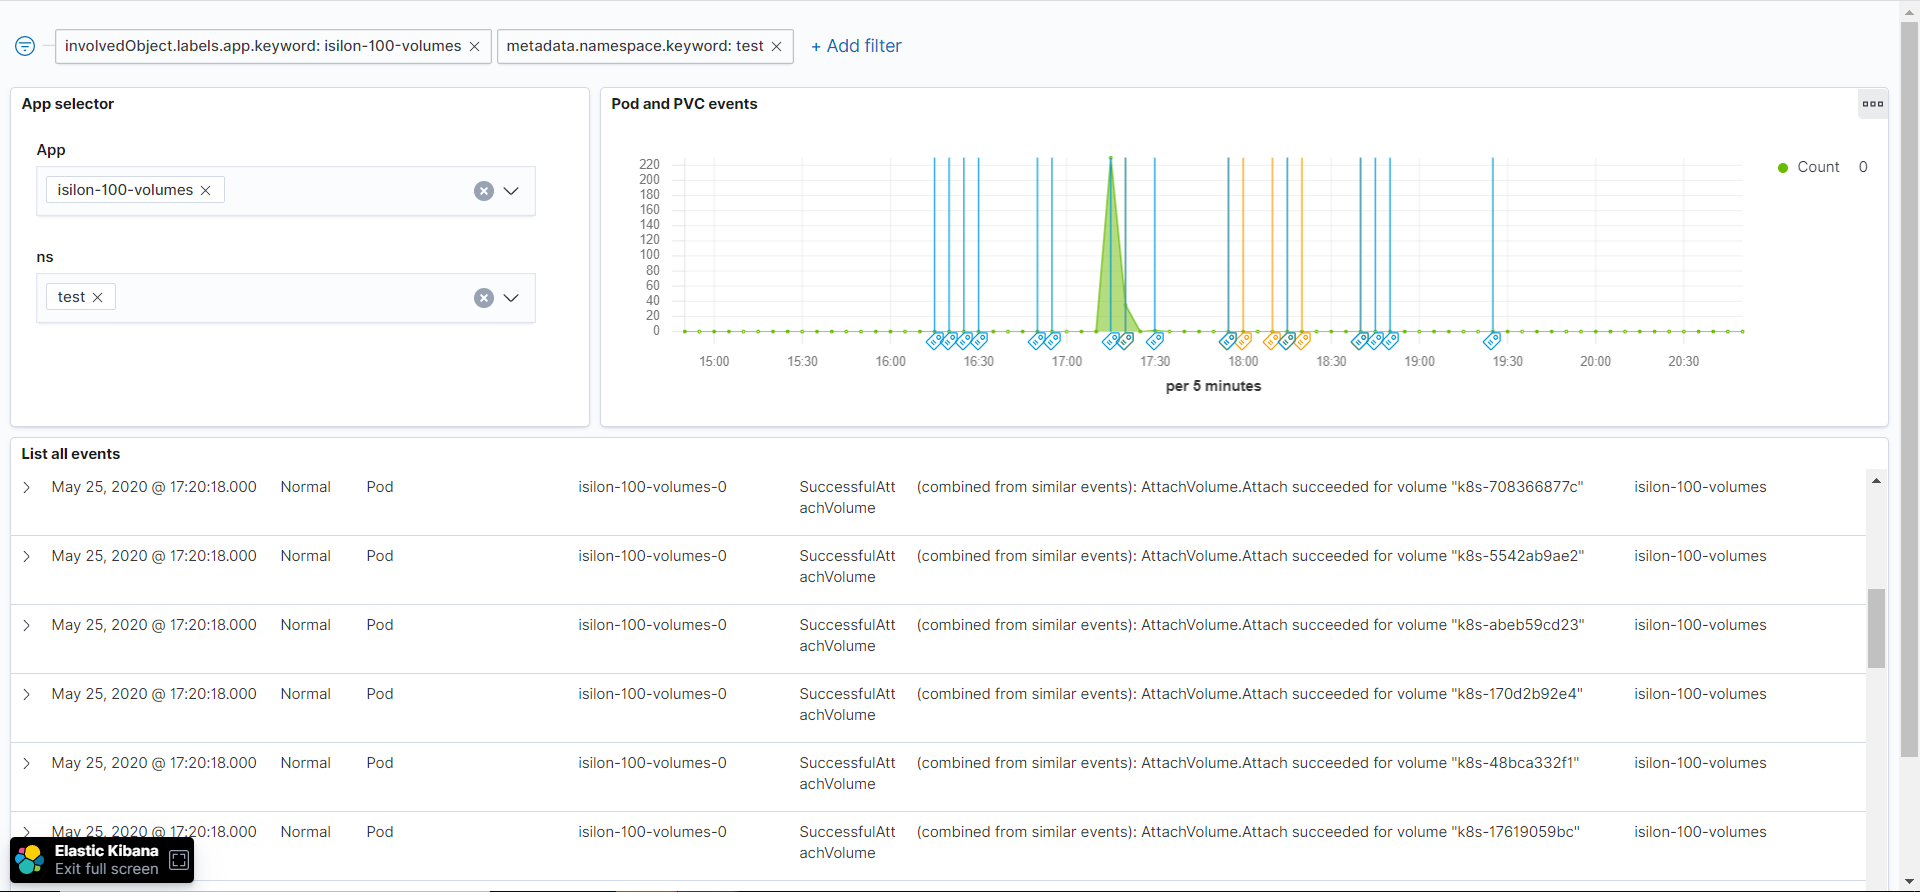
The PV/PVC/Pod status is available with kubectl get pv,pvc,po and you can track the lifecycle through Kubernetes events with kubectl get events.
How to get the events?
The Kubernetes events reporting stack is composed of:
- kubernetes-event-exporter for event collection
- elasticsearch for the database
- kibana for the reporting engine
kubernetes-event-exporter
This utility developed by OpsGenie will basically dump the events and forward them to different destinations (sink in their terminology).
ElasticSearch & Kibana
The deployment uses the Elastic Cloud on Kubernetes.
Thanks to the operator framework, we can easily configure and deploy a secured version of ElasticSearch and Kibana:
kubectl apply -f https://download.elastic.co/downloads/eck/1.1.1/all-in-one.yaml
After running install.sh, you can load the kibana dashboard with:
curl -X POST "localhost:5601/api/kibana/dashboards/import?exclude=index-pattern" \
  -H 'Content-Type: application/json' -d @kibana-dashboard.json
Wrap-up
That Kubernetes events monitoring stack has been used and tested for one-shot statistics and analytics. The component and approach can fit other use-cases like observability, alerting, and monitoring.
There is more to say about the kubernetes-event-exporter configuration in the ConfigMap and Secrets post.